See exactly what is slowing down production.
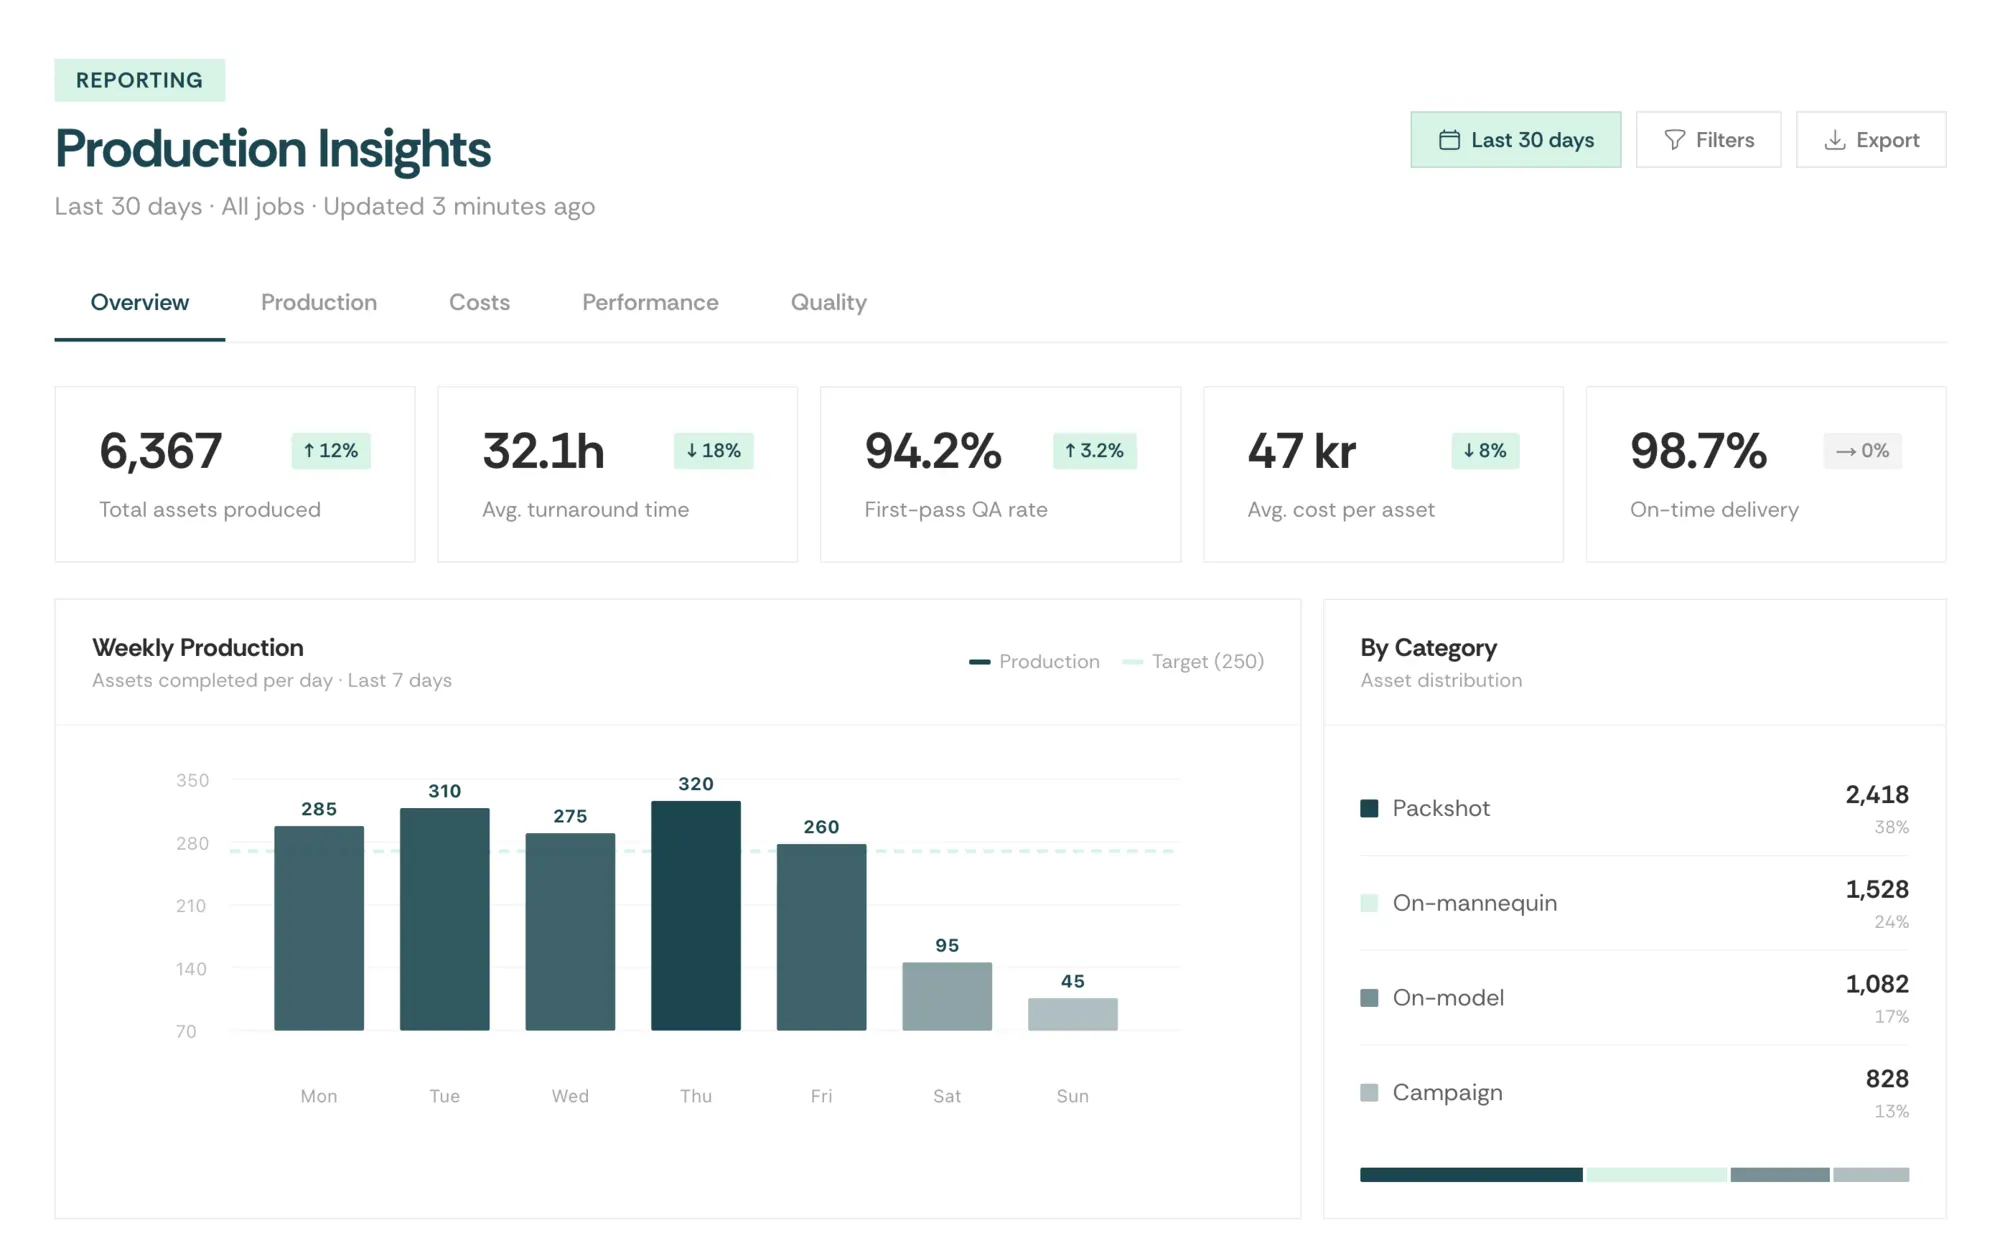
Real-time production KPI dashboards: track throughput times, bottlenecks, and cost-per-asset, and see exactly where time and money are spent - whether you produce for in-house brands or external clients.
Production reporting and analytics.
Not just more numbers.
Production analytics
See exactly what's being produced - and how fast
Track throughput and lead time across photographers, studios, and categories. Find bottlenecks before they slow down your time-to-market, and optimize production based on data - not gut feelings.
Economics & profitability
From cost-per-asset to margin per client
Gain granular insights into what each deliverable costs - and what you earn from it. In-house studios can see cost-per-asset and budget in real time; commercial studios can track margins and billable time per client and project.
Team performance
Track productivity and studio utilization
See overall team output and individual contributions, and track studio utilization in real time. Balance workload, plan capacity, and identify where coaching can make a difference.
Quality insights
Measure and improve quality over time
Track QA pass rates, revision counts, and error patterns. Identify systemic issues and watch your quality evolve over weeks and months.
See what you didn't know
you were missing.
Book a demo and get a look into your own production data. We will show you exactly how PixelAdmin consolidates cost-per-asset, margin, and studio utilization into a single KPI dashboard - and what that means for your decisions.
See how reporting fits in for in-house brand and e-commerce studios or commercial photo studios with client deliveries.