

The contracts look small on their own. A spreadsheet here, a generic project management tool there, a transfer service for delivery, a review tool the photographers picked, plus a shared drive nobody really owns. None of them feel expensive. Then the producer goes on parental leave, the studio takes on a bigger client, and suddenly you cannot answer a basic question - how many shoots are in the queue this week - without four logins and a guess.
Fragmented studio tools are cheap in isolation and expensive in aggregate, and most of the cost is hidden. This article puts numbers on the parts of the bill that never show up on an invoice - the seven hidden costs of running a content studio on a stack of disconnected tools, and how to estimate each one for your own operation.
TL;DR
- Fragmented studio tools generate seven hidden costs: licence sprawl, context switching, integration brittleness, training overhead, reporting effort, security surface area, and slow throughput.
- The biggest line item is almost always the context-switching tax - typically 30 to 60 minutes per person per day - and it never appears on an invoice.
- Each cost has a defensible formula. Sample math for a 12-person studio totals roughly 1.4 million kr. per year.
- Consolidation reliably shrinks five of the seven lines; two - training and integration - go down but never to zero.
- Use the totals to feed a studio software ROI business case the CFO can sign.
1. Licence sprawl across departments
Spreadsheet tools, generic project management, transfer services, review tools, a separate cloud drive, plus seats in the marketing team's brand-asset library. Each contract is small; together they are large. Most mid-sized studios are paying 60,000–180,000 kr. per year on overlapping subscriptions, and nobody owns the total because the contracts sit across procurement, IT, and the studio's own card.
Formula. Sum every annual subscription that touches creative production, including seats your team uses inside other departments' tools. Add 15% for shadow IT - the trial that never got cancelled.
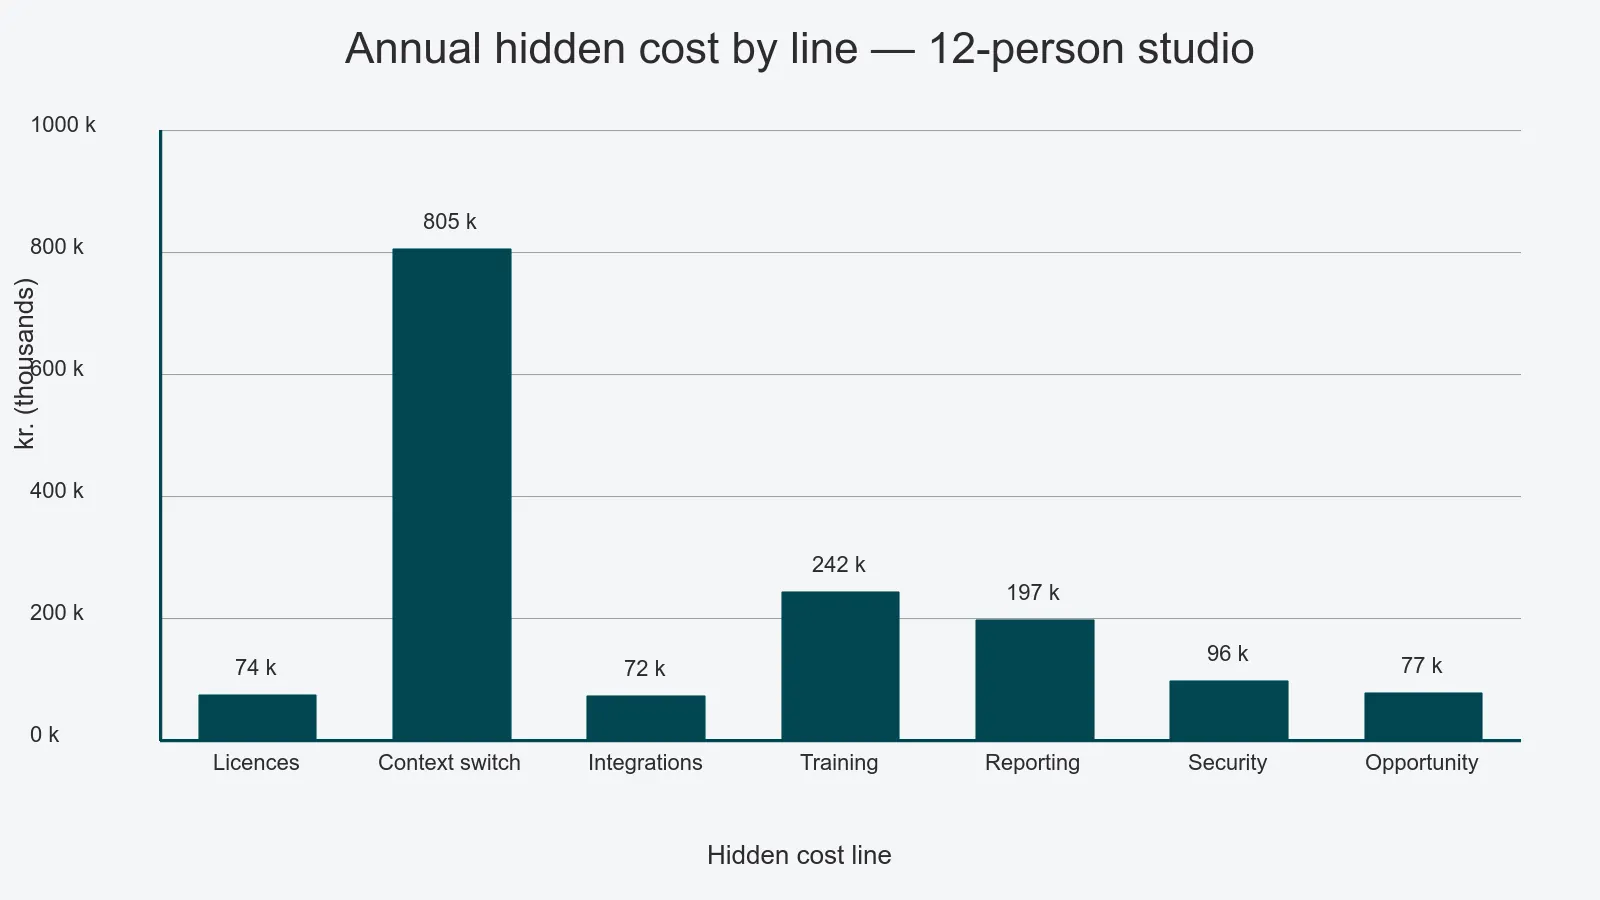
Sample math. Eight tools at 8,000 kr. average annual cost, plus 15% shadow = roughly 73,600 kr. per year. Smaller than the next line, but the cleanest one to retire.
2. The context-switching tax
This is the cost nobody captures. Every time a producer copies a shot list from one tool into another, every time a photographer asks "where do I post this?", every time a retoucher hunts for the brief in three places, you are paying for context switching. Cognitive-load research from the American Psychological Association on multitasking puts the productivity cost of frequent task switching as high as 40% of working time.
Formula. Average daily switches per person, times 2 minutes recovery, times headcount, times 230 working days, times fully loaded hourly cost.
Sample math. 25 switches per day, 2 minutes each, 12 people, 230 days, 350 kr. per hour fully loaded = roughly 805,000 kr. per year.
This is the single biggest hidden cost in the model, and it is the one most studios refuse to count because it does not appear on a timesheet. It is also the one consolidation flattens hardest.
3. Integration brittleness
When tools don't talk natively, somebody is wiring them together. CSV exports, copy-paste, an automation built on a no-code tool by the producer who left, a manual reconciliation every Friday. Each integration is a failure mode waiting to happen: the column header changed, the API rate-limited, the export ran but nobody noticed it was empty.
Formula. Hours per week on manual data movement and broken-integration triage, times 47 weeks, times fully loaded hourly cost. Add the cost of one or two assets per quarter that ship wrong because of a bad export.
Sample math. 4 hours per week at 350 kr. fully loaded, plus 4 mis-shipped assets per year at 1,500 kr. rework each = roughly 71,800 kr. per year.
A purpose-built integrations layer with native connectors and webhooks collapses most of this, but the line only goes to zero in vendor decks - not in real life.
4. Training overhead per new hire
Every new hire learns five tools instead of one. The ramp-up is not a week of platform training; it is a quarter of incidental learning, where senior staff get pulled away to explain how the studio's particular blend of spreadsheet conventions, naming standards, and review workflow actually works. There is no documentation because each tool has its own.
Formula. Extra weeks to full productivity, times fully loaded cost per week, times annual hires, plus senior time spent on onboarding.
Sample math. 4 extra weeks of ramp at 14,000 kr. per week, times 4 hires per year, plus 30 hours of senior time at 600 kr. = roughly 242,000 kr. per year. Even at two hires a year, the number is material.
5. Reporting effort across systems
Producing a single weekly KPI report - turnaround time, throughput, cost per asset, capacity utilisation - typically requires pulling data from three or four sources, reconciling formats, and rebuilding the spreadsheet from scratch. The studio manager loses a day a week to it. The reports are stale by the time they reach the leadership meeting.
Formula. Hours per week on report assembly, times 47 weeks, times fully loaded cost of the person doing it. Add a hedge for decisions made on stale data.
Sample math. 6 hours per week at a 700 kr. fully loaded senior rate = roughly 197,400 kr. per year.
A unified reporting and analytics layer eliminates most of this - not because spreadsheets disappear, but because the underlying data lives in one place and the weekly report becomes a saved view, not a Monday-morning rebuild.
6. Security and compliance surface area
Each tool is a separate access list, a separate data processing agreement, a separate incident-response process, and a separate place a leaver's account has to be deactivated. Under GDPR, every system holding personal data - model releases, contributor records, contact details - is in scope. Five tools means five DPAs, five access reviews, and five ways to get audit findings.
Formula. Hours per quarter on access reviews and DPA renewals, times number of systems, times compliance officer rate. Add the regulatory risk of one delayed deactivation per year.
Sample math. 6 hours per quarter, 4 quarters, 5 systems, 800 kr. per hour = roughly 96,000 kr. per year. The single-system equivalent is closer to 25,000 kr. - and the audit story is shorter.
7. Opportunity cost of slow throughput
The hidden cost most often missed: the work the studio cannot take on because the existing stack caps throughput. A studio that can run 8,000 packshots a year at fragmented quality could run 11,000 on a unified workflow - same headcount, same studio days. The 3,000 unrun packshots are not a saving; they are revenue you never invoiced.
Formula. Capped annual volume, times a realistic uplift percentage, times contribution margin per asset.
Sample math. 8,000 packshots, 12% uplift, 80 kr. margin = roughly 76,800 kr. per year, growing as volume scales.
A unified workflow automation layer is what makes that uplift defensible - not because it shoots faster, but because it removes the coordination ceiling that fragmented studio tools impose by design.
What consolidation actually saves - and what stays the same
The seven costs above are not all eliminated when you consolidate. Pretending they are is how ROI models lose credibility.
Goes away or shrinks substantially. Licence sprawl, context switching, reporting effort, security surface area, opportunity cost. Studios on a unified content operations platform typically recover 70 to 90 percent of these line items within 12 months of full rollout.
Stays meaningful. Training overhead and integration cost. New hires still need onboarding; integrations to your PIM and ERP still cost something to build and maintain. The platform changes the slope of these lines, not their existence.
Stays the same. Software is not a substitute for production management. If your briefs are ambiguous and your standards undocumented, a platform makes the chaos legible - it does not remove it.
For the 12-person studio in the worked numbers above, the seven-line total runs to roughly 1.4 million kr. per year. Consolidation realistically recovers 800,000 to 1,000,000 kr. of that. That is the number worth taking into your studio software ROI business case - and the number worth measuring honestly before you sign anything.
If you want to map this against your own stack, book a walkthrough with us and we will work through the seven lines with your numbers - including the two that stay.