

If you have ever sat in a Monday morning planning meeting and tried to answer "how fast is the studio actually producing?", you have already met the problem this article solves. "Faster" is not a number. "More assets" is not a number. Content velocity is.
This guide gives you the working definition, the formula and benchmark range, the four levers that grow it, and the anti-patterns to avoid when you start measuring it.
What is content velocity?
Content velocity is the rate at which a studio publishes finished, channel-ready assets relative to the resources invested to produce them. It is not raw output, and it is not speed in isolation - it is throughput per unit of capacity, measured against a quality bar that does not move.
In plain language: if your studio shipped 1,200 approved packshots last month with five FTEs, your content velocity was 60 finished assets per FTE per week. If next month you ship 1,400 with the same five FTEs at the same quality, your velocity went up. If you ship 1,400 by hiring two more retouchers, your output went up - but velocity stayed flat or fell.
The distinction matters because almost every "we need more content" conversation defaults to hiring. Velocity reframes it as a productivity question first.
How to measure content velocity
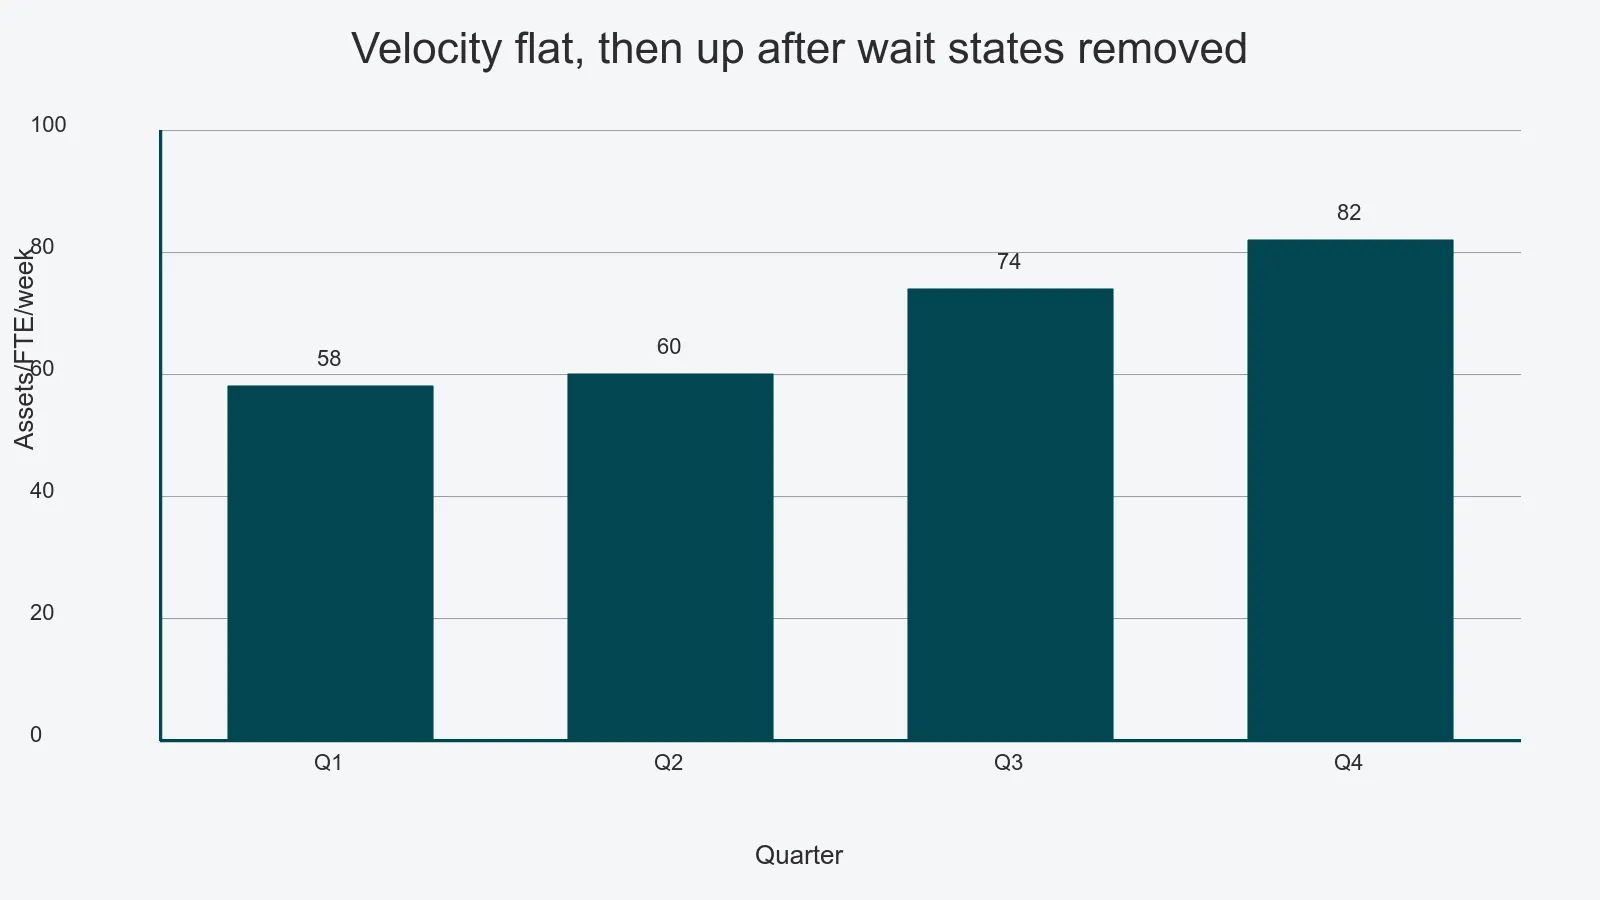
The headline formula is simple. Take the count of approved, channel-ready assets shipped in a period, divide by the number of full-time-equivalent production staff (photographers, retouchers, producers - not management or sales), and normalise to a week. That gives you assets per FTE per week, the number you put on the dashboard.
A typical commercial packshot studio sits between 40 and 120 finished assets per FTE per week, heavily dependent on garment complexity, retouching depth, and channel count. The spread is wide on purpose - compare yourself to your own trend, not to a published average.
Velocity reads cleanest alongside two or three operational KPIs that catch where the throughput is or is not holding up - shoot-day utilization, sample-to-shoot lead time, first-pass approval rate. Those, and the rest of the operating dashboard, live in the studio throughput KPIs guide, which is the broader set of KPIs velocity sits inside.
Why content velocity matters
Three reasons it has become the core operating metric for content studios.
E-commerce conversion correlates with on-time SKU coverage. A product detail page without a hero image converts at a fraction of one with full imagery. Every day a SKU goes live without complete assets is lost gross margin. Buyers care about velocity because revenue cares about velocity.
Capacity is finite, demand is not. Brands keep adding SKUs, channels, and seasonal drops. The studio that grows velocity by 20% a year keeps up without proportional headcount growth. The studio that does not eventually loses the account or hires its way to flat margin.
It is the only metric that exposes operational waste. Output can rise just by working harder. Velocity rises only when you remove friction. That makes it the right number to put on a dashboard.
The four levers that grow content velocity
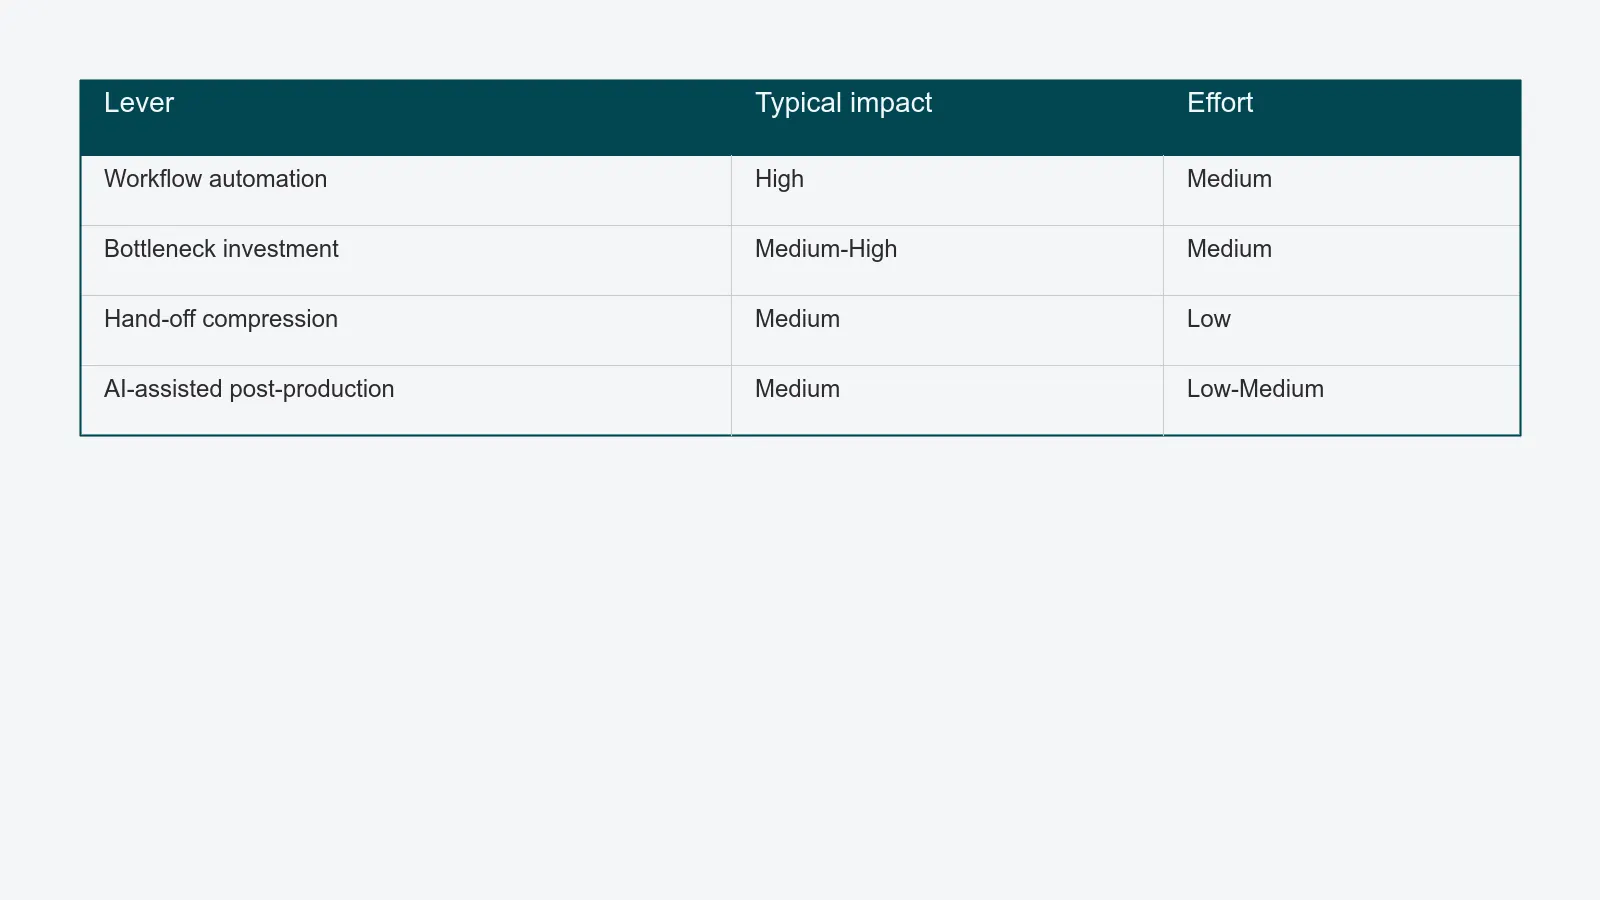
Velocity is not a slogan. It is the output of four mechanical things, in roughly this order of impact.
1. Workflow automation
The single biggest lever. If a sample sits in the studio for a day before it is logged, if a captured file waits in a folder before it is assigned to a retoucher, if an approved asset waits to be exported manually - those are wait states, and they crush velocity even when no one is idle.
Connecting intake, capture, retouching, review, and delivery on a single platform turns those wait states into automatic transitions. The full mechanics are in how to reduce packshot turnaround time, which walks through the six handoffs and where most of the days are hiding.
2. Throughput investment at the bottleneck
Once the wait states are gone, the visible bottleneck - usually retouching - gets the next round of investment. That can mean an extra retoucher, but more often it means a better tool, a templated retouching action, or a queue that auto-assigns to whoever has capacity. Investing anywhere except the bottleneck moves velocity by zero.
3. Hand-off compression
Every time a job changes hands - from intake to producer, producer to photographer, photographer to retoucher, retoucher to QA, QA to delivery - there is a small communication tax. Multiply that across thousands of assets a season and you have lost a week. Hand-off compression means fewer hand-offs, more context carried in the system itself, and review that happens in-place rather than in email threads.
4. AI-assisted post-production
Background removal, exposure normalisation, auto-cropping, and routine masking can shave 20–40% off the retoucher's per-image time when used well. The retoucher still owns colour, fabric, and finish - the parts that need a trained eye. The boring 80% gets handled before they open the file. This is what a connected content operations platform actually delivers in production.
Velocity is not raw output
A studio can grow output by working evenings, hiring contractors, or lowering the quality bar. None of those grow velocity.
- Working evenings raises output for one season and burns out the team in the next. Velocity falls.
- Hiring contractors raises capacity but usually drops per-FTE throughput because of onboarding cost and quality variance.
- Lowering the quality bar raises both output and reported velocity - until reshoots and rejected assets show up in the next reporting cycle.
The right way to think about it: output is a top-line number; velocity is a margin number. The first tells you what shipped. The second tells you whether you are getting better at shipping.
Anti-patterns when you start measuring it
Three traps to watch for in the first quarter of measuring content velocity.
Gaming the metric by lowering quality. If "approved, channel-ready" is fuzzy, the team will redefine it downward. Lock the QA bar in writing - what counts as approved, who approves, what triggers a reshoot - before you start tracking velocity, not after.
Punishing complex jobs. A six-angle hero shoot with creative retouching is structurally slower than a flat-lay marketplace job. If you average them together, complex jobs look like failures. Segment your velocity by shoot type, not just by total.
Measuring the wrong unit. "Files delivered" is not the same as "assets shipped." A single approved asset might generate 12 channel-specific exports. Pick the unit your buyer cares about (usually the approved master) and stick with it.
Where to go next
Three concrete next steps if you want to make content velocity your operating metric:
- Read the studio throughput KPIs guide for the broader set of KPIs velocity sits inside, and what to target per shoot type.
- See how PixelAdmin's real-time reporting dashboards surface assets-per-week-per-FTE without manual roll-ups.
- Map your current handoffs against the packshot turnaround levers to find which one to pull first.
Content velocity is not a vanity metric and it is not a slogan. It is the number that tells you whether the system you built is getting better, holding, or quietly degrading. The studios that grow it on purpose are the ones that stay ahead of the next season's brief.